Keep up to date with our news
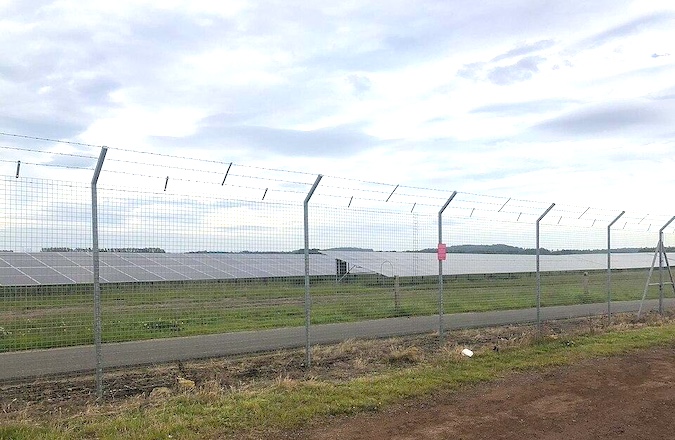
Dutch Temporary Framework for Solar near Airports
In March 2025, glare from a nearby solar farm temporarily [...]

Onward 2030 Work Package 3: The Future of Wind Mitigation
Onward 2030 Work Package 3 (WP3) has been produced with [...]

What is Electronic Conspicuity, and How Could it Unlock Onshore Wind?
Electronic Conspicuity (or EC) is a term used to describe [...]
What Data Do Solar Glare Consultants Need Before They Can Model The Impact?
For any project involving solar panels, or any other potentially [...]

Feline Happiness and Sustainability: Small Changes That Make a Difference
Here at Pager Power, sustainability is at the heart of [...]

Welcoming Eleanor Coughlan, Our New Administrative Officer
We are pleased to announce the newest addition to our [...]

Onward 2030 Work Package 2: What do developers need to know about Instrument Flight Procedures (IFPs)?
What are the Onward 2030 Work Packages? Onward 2030 has [...]

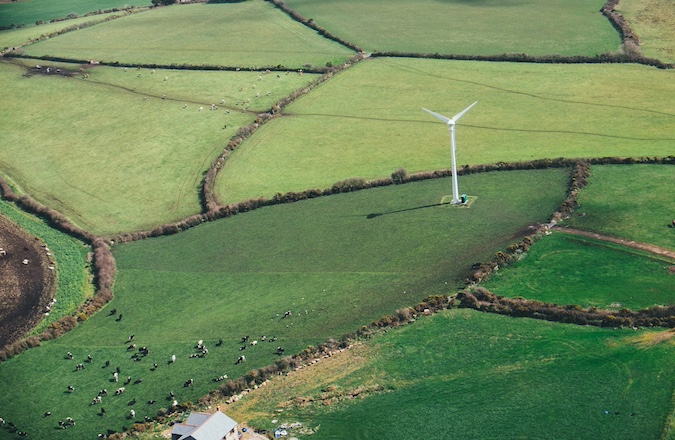
UK Onshore Wind: Why Invest in Repowering?
There is currently 316 MW of operational onshore wind capacity [...]

What Happens if I Submit a Wind Turbine Planning Application Without an Aviation Assessment?
Planning applications for wind developments consider many aspects to ensure [...]

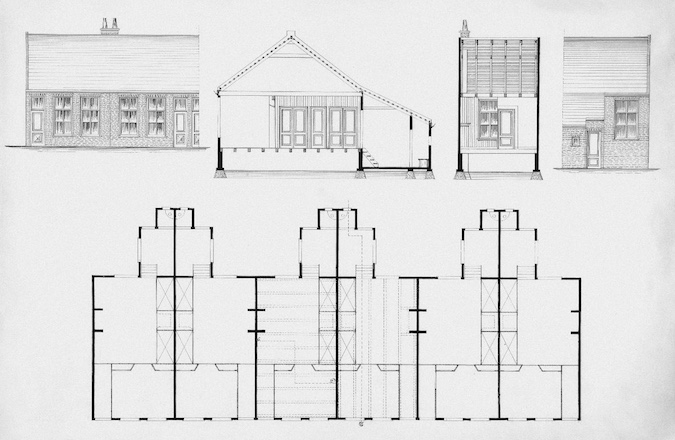
How Daylight Sunlight Assessments Support Different RIBA Stages
The RIBA Plan of Work [1] is the UK document [...]
El Niño: What Is It, and What Can It Mean for UK Renewables?
El Niño is typically used to describe a natural Pacific [...]

What Is the Difference Between a Basic Aviation Feasibility Check and a Detailed Aviation Risk Assessment?
A basic aviation feasibility check is mainly designed to answer [...]

How Military Low Flying Affects Wind Turbines, and Vice Versa
When a wind development is proposed, be it a single [...]

What Is the Difference Between Daylight Sunlight Assessments and Right to Light Assessments?
Daylight Sunlight Assessments and Right to Light Assessments are commonly [...]

Rooftop Solar Glare and Permitted Development Rights: A Residential Nightmare?
Permitted development rights Permitted development rights in the UK allow [...]

Project NJORD: The Next Step in Air Defence and Wind Farm Coexistence
The UK Government has committed to deploying 50GW of offshore [...]

The 2026 State of Play for Cooperative Automatic Detection Lighting Systems in the UK
Automatic Detection Lighting Systems (or ADLS as it is more [...]
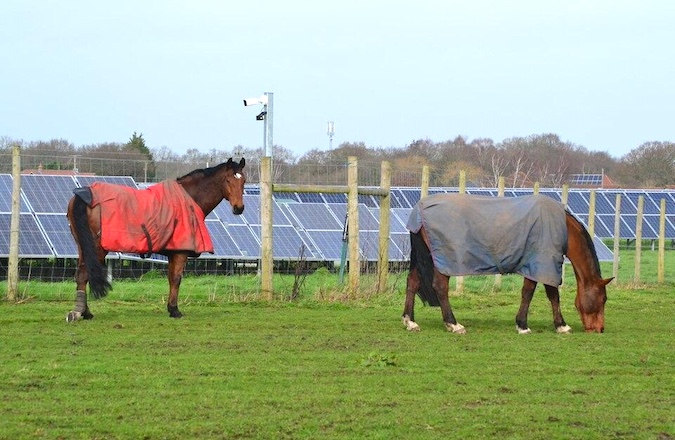
British Horse Society Guidance and Glint and Glare
In August 2025, the British Horse Society (BHS) updated their [...]
How do Wind Turbines Affect Met Radar and What Constitutes a Significant Impact?
There are different types of radar that can be affected [...]

Can a Tall Building Block Telecoms/Microwave Links, and How do I Check Before Construction?
Electromagnetic waves perform an increasingly important function in our everyday [...]

uPVC: Built to Last, Not to Landfill
As the sun brightens and temperatures begin to rise you [...]

How Early in a Project Should I Commission a Glint and Glare Assessment?
How early in a project should I commission a glint [...]
Permitted Development for Wind Turbines: What the New Consultation Means for You
England's wind turbine planning standards are being reviewed in their [...]

JP Morgan’s New Headquarters Set to Become Tallest Tower in Canary Wharf
Plans for JP Morgan’s new headquarters, which proposes to become [...]


