Assessing the potential impact of a project on aviation and radar is something that is vital to successful wind development. Since issues of this nature have been known to delay, or completely stop, projects from going ahead we always recommend that developers assess aviation risk early on. It was because of this, that we developed our online Aviation Risk Report in the first place.
However, the Aviation Risk Report, as you know it, is soon to evolve into v3.0: the Aviation Risk Assessment for (UK sites) on the 8th April 2014. And it will be better than ever. We’re excited because it will have features that will enable you to assess the aviation risk of a wind development in 3 new ways…
1. ALL identified Aviation Risks are given a risk level – Know where to prioritise your resources
Every single identified potential aviation issue in the assessment gets a ranking of whether the risk level is High, Medium or Low. This will help you to focus your resources to minimise the highest project risks.
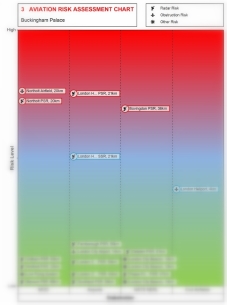
2. Aviation Risk Assessment Chart – Quicker evaluation of identified aviation risks
Most of us know the phrase “a picture can speak a thousand words” so in the Aviation Risk Assessment you can expect to see a diagrammatic display of all the identified potential sources of aviation risk (in the order from highest risk level to the lowest).
And – to make things even easier – divided by concerned stakeholder. Great for taking in all identified issues at a glance.
3. Multiple Turbines – Assess the aviation risk of a wind farm
You have never been able to do this before. Enter – or upload – the coordinates of many turbines and get an overall risk level for each.
The Aviation Risk Chart will show you the unique sources of aviation risk for the whole project, and rank them based on the score for the worst affected turbine.
For example, consider a 3 turbine project that has Staxton Wold ASACS Radar identified as a risk. It is “High” risk for Turbine 1, but “Medium” risk for the other 2. It would be plotted on the chart under the “High” risk level.
If you have any questions about the new report or our online system just get in touch. It is able to be used for both onshore and offshore wind developments.
Phone: +44 (0) 1787 319001 or email: info@pagerpower.com