The deployment of solar photovoltaics is set to lead the renewables race in the USA in 2022 as its development is expected to exceed that of its renewable counterparts, most closely wind [1]. The figures show that new capacity for wind, solar and batteries is expected to exceed 30GW in 2022, with 16.6GW coming from solar [2]. This article investigates why solar may be the preferred renewable energy provider, the future of solar across the USA, and calculates what achieving these predictions means in terms of land usage.
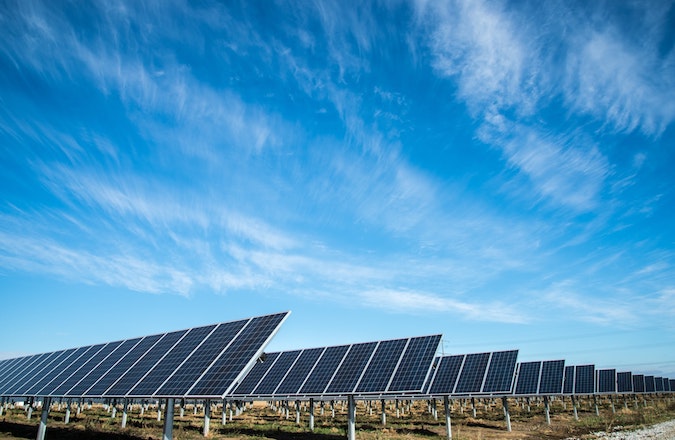
Figure 1: Solar farm in Lincoln, USA. [9]
Why Solar Over Wind?
Whilst wind turbines have a greater development history in terms of their deployment at a commercial scale, large scale solar has only in recent years become a viable alternative. For many years, solar developments that could compete with wind developments in terms of power output simply weren’t achievable. However, with costs of solar coming down, alongside the increased appetite to develop large-scale commercial schemes, solar is now a real alternative. In general, solar developments are also less controversial due to the reduced visual impact at greater distances, and other planning considerations such as aviation or ecological issues are generally less sensitive with solar development. All this together means that developers are looking to solar more than ever, particularly in locations where wind has already been ruled too difficult to develop.
2022: The Coming Year in Solar
The immediate future for solar PV in the USA is promising, with continued growth within the sector expected. According to Forbes [3] ‘of all renewable energy generation, solar PV is expected to grow the fastest from now [4] to 2050’. In 2022, 16.6GW of solar PV is expected to be deployed. The area of the USA with the highest predicted growth of solar is Texas by some margin [5], followed by California. Between them, they are expected to develop around 10GW of solar in 2022 [6].
Much like in the rest of the world, these larger sites will likely be paired with energy storage solutions (typically batteries), to help with delivering the energy when needed, and storing it when it isn’t. This means that energy created from solar PV becomes much more versatile and practical in real-world scenarios.
What’s The Mid to Long Term Future?
The mid to long term future will be very much dependant on meeting ambitious targets. The Solar Futures Study, conducted on behalf of the Office of Energy Efficiency and Renewable Energy [7], states that ‘aggressive cost reductions, supportive policies, and large-scale electrification, solar could account for as much as 40% of the nation’s electricity supply by 2035 and 45% by 2050’. An average annual growth of 30 gigawatts alternating current (GWac) per year between now and 2025 is required to meet these targets. This is then required to increase to 60GW per year between 2025 and 2030 – this is quite a significant rate of growth.
The study writes that the 2020-2025 target requires four times the current rate of deployment. However it states that this is achievable considering reduced costs, public pressure and evolving policies which will promote the growth of solar. However, as stated previously, the S&P Global study says that only 16.6 GW of new solar is to be added in 2022. It is clear from the figures that there is a lot of work to do in the coming year to make up for shortfall in the predicted and the proposed.
Land Usage
If the 2020-2025 targets are to be met, how much land is required to support this level of solar deployment? [8] Assume 1MW of solar and the associated infrastructure covers 4 acres, and an Inverter Load Ratio (DC to AC) of 1.2, the amount of land needed to develop 30GWac would be 144,000 acres or 58,275 hectares. This is equivalent to approximately 269,098 American football pitches or 201,681 football (soccer) pitches per year used for solar PV until 2025, with the target to double the rate from 2025. These figures put it into perspective how much land the solar PV will cover. A rollout of 30GWac per year is equivalent to over 600 new Cleve Hill Solar Farms (the UK’s largest consented solar farm at the time of writing, located in Kent) or over 43 Gemini projects (a recently consented 690MW solar and storage development in Nevada – to be the biggest in the USA).
Conclusions
If the predictions are correct, solar has a big future in the USA. Of course, this will be subject to costs coming down over the next 10-20 years and an aggressive rate of deployment. The targets to ensure that solar is a significant part of the energy mix will need to be met in the next 10 years otherwise the aim for solar to meet 45% of the US’s energy demand by 2050 will fall away. The main factors that will likely influence its deployment are the changing appetite for renewables (either among the general population or within the elected administrations), sustainability and the added focus on reducing the effects of global warming.
About Pager Power
Pager Power has developed proprietary software for evaluating all aspects of glint and glare from a solar development, including areas causing significant impacts and calculating the level of screening required to adequately mitigate these effects. If you would like advice for a project, or are interested in more information, please do not hesitate to get in touch.
References
[1] Commodities 2022: Most new US generating capacity will be solar, followed by wind. S&P Global, Kassia Micek, 28 December 2021. Last accessed 19/01/2022
[2] S&P Global Platts Analytics’ North American Electricity Short Term Forecast, as referenced in the above article.
[3] The Future Of US Solar Is Bright. Forbes, Joshua Rhodes, Feb 3 2020. Last accessed 19/01/2022
[4] 2020 at the time of publishing.
[5] Approximately 2 to 3 times as much.
[6] S&P Global Platts Analytics’ North American Electricity Short Term Forecast, as referenced in footnote 1.
[7] Solar Futures Study. Produced by the U.S. Department of Energy Solar Energy Technologies Office (SETO) and the National Renewable Energy Laboratory (NREL), September 8, 2021. Last accessed 19/01/2022
[8] Assuming all of the solar PV is development as ground mounted schemes, which will not be the case.
[9] American Public Power Association (Oct 2017), last accessed January 2022 via Unsplash.com. Available at: https://unsplash.com/photos/XGAZzyLzn18
