World’s Biggest Emitter May Have Reached Its Peak

Carbon dioxide (CO2) emissions are one of the main causes of global warming. CO2 is a greenhouse gas. What this means is, when the earth radiates infra-red radiation (i.e. heat), CO2 in the atmosphere absorbs some of it and re-radiates it back towards the earth’s surface. This is something that non-greenhouse gasses like nitrogen or oxygen don’t do, because they don’t absorb radiation at infra-red frequencies.
Biggest Emitters
The biggest emitter of CO2 in the world, in absolute terms when grouped by nation, is China [1], and it has been for almost two decades. In 2023, China accounted for more than 30% of worldwide emissions. In second place was the USA with 13%, followed by India at 8.1%.
This should not be confused with other related measures. For example, the USA is the country that has emitted more than any other in history [2], because China’s high levels of emissions are relatively recent. Meanwhile, Qatar emits the most per capita [3], followed by a number of other Asian and middle eastern countries.
The debate around who should shoulder the most responsibility for reducing emissions is complex and comprises numerous interwoven strands, including but not limited to:
- Who causes the biggest problem now.
- Who has caused the biggest problem in the past.
- Who has the resources to make improvements.
- Who has already benefited from a dirty economy to achieve a powerful standing in the world.
- How dirty imported or outsourced energy production is.
Thankfully, that debate is not the topic of this article.
China
China has the unusual dual accolades of being the biggest emitter of CO2, but also arguably the biggest renewable energy powerhouse in the world.
In 2022, China was able to install about the same amount of solar power as the rest of the world put together [4]. It is reducing its dependence on fossil fuels at a rapid pace.
During the summer of this year, Reuters reported [5] that almost two thirds of large wind and solar developments that were under construction around the world were located in China.
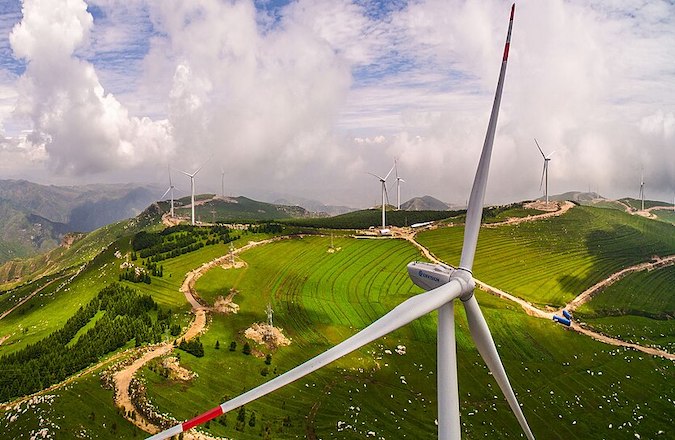
Figure 1: Wind Farm in Guangling County, Shanxi, China. [8]
And as 2024 draws towards a close, an expert report published by the Centre for Research of Energy and Clean Air shows [6] that 44% of experts believe China’s emissions will peak within 2025. Whilst this is not exactly a consensus on the matter, it is worth remembering that China’s official target [7] is to reach peak emissions by 2030, and that the CREA report signals an increasing confidence in China’s green ambitions.
As ever, it remains to be seen whether these more optimistic forecasts come to pass. China is, and will likely remain, at the centre of many world events. At the time of writing, much is being made of potential incoming trade wars and tariffs between China and the incoming administration in the USA and, perhaps to a lesser extent, Europe. In addition, military tensions and the resulting alliances all play a role in the extent to which environmentally friendly policies remain at the forefront for any nation. Nevertheless, China is building something of a track record when it comes to renewables, which we can all hope will continue into 2025 and beyond.
Pager Power
Pager Power is proud to have supported developers across 60 countries in realising their renewable energy and building projects. For more information about how we can help, please don’t hesitate to get in touch.
References
[1] Statista, total emissions data for 2023 (link), last accessed December 2024[2] Statista, cumulative CO2 data (link), last accessed December 2024[3] Statista, per-capita emissions data for 2023 (link), last accessed December 2024[4] Hilton, I (March 2024), How China Became the World’s Leader on Renewable Energy (link), Yale, last accessed December 2024.[5] Howe, C (July 2024), China is building two-thirds of new wind and solar globally, report says (link), Reuters, last accessed December 2024[6] Frost, R (November 2024), Could China’s CO2 emissions peak by 2025? Experts optimistic about the superpower’s green transition (link), Euronews, last accessed December 2024[7] Hawkins, A (November 2024), China’s CO2 emissions have peaked or will in 2025, say 44% of experts in survey (link), The Guardian, last accessed December 2024[8] Wind Farm in Guangling County, Shanxi from Wikimedia Commons. Last accessed on 10th December 2024. Available at: https://commons.wikimedia.org/wiki/File:Wind_Farm_in_Guangling_County,_Shanxi.jpgpost contents
About the Author: Kai Frolic
Latest News
US Continues to Build Out Solar Capacity
Earlier this month, the Solar Energy Industries Association (SEIA) released [...]
China’s Airborne Wind Turbines
In early 2026, China successfully developed an airborne wind turbine [...]
Shadow Flicker Assessments for Wind Turbines: A 2026 Update
Shadow flicker is the effect of rotating turbine blades, causing [...]


