Whilst the impact of Solar Photovoltaic (PV) developments to their surrounding environment might be small or negligible, the combined or cumulative effects of multiple developments may have a greater impact.

Solar PV developments can affect their surrounding environment and hence a number of environmental impacts are required to be assessed during their planning stage. One of these effects is solar reflections known as Glint and Glare. Solar panels are designed to absorb sunlight and produce electricity. However, they can also reflect it and cause solar reflections affecting drivers, residents, aviators and other receptors. With a continuous increase in the both numbers and sizes of such PV developments cumulative concerns are likely to increase in the near future.
What happened with cumulative impacts of Wind Farms?
We have worked on over 24% of UK Wind Farms and have undertaken work in 38 countries.
In the UK we have witnessed the shift in stakeholder’s position when it comes to cumulative impacts. During the early years, whilst there could have been impacts of a wind farm on radar, an airport or other aviation facility the effects could have been accepted. However, with the continuous proliferation of wind turbines, objections started to increase as a result of cumulative concerns. Nowadays cumulative concerns are often more of an issue when compared to the impact of the individual project per se.
Numbers are a good way to see the coming rapid growth of Solar PV. Let’s have a look at UK and global capacity numbers and forecasts.
Solar Capacity Figures and Forecasts
Worldwide
On a global scale the growth figures are impressive:
- 2009: At the end of the year the world’s PV capacity was approximately 23GW.
- 2010: A further 40GW was added.
- 2011: The total capacity reached 70.5GW.
- 2012: The 100GW mark was reached with the addition of 30GW.
- 2013: An additional 38GW of capacity was installed.
- 2014: The forecast for the end of this year is 174 – 191GW.
- Future: As 2018 closes global capacity may reach 320GW – 430GW [1]. This is 3-4 times the global capacity of 2012!
Countries currently at the top of installed capacity are Germany, China, Italy, Japan and the USA [1] [2] Europe is the leading continent in terms of global capacity representing over 55% of the total global capacity. In 2013 Germany was the European leader with over 3GW of added capacity, followed by the UK, Italy, Romania and Greece. A significant increase has been seen in Belgium, France and Denmark [1]. Outside Europe countries that have seen noteworthy growth are India, Korea, Thailand and Canada [1].
 UK
UK
According to the Department of Energy & Climate Change [3]:
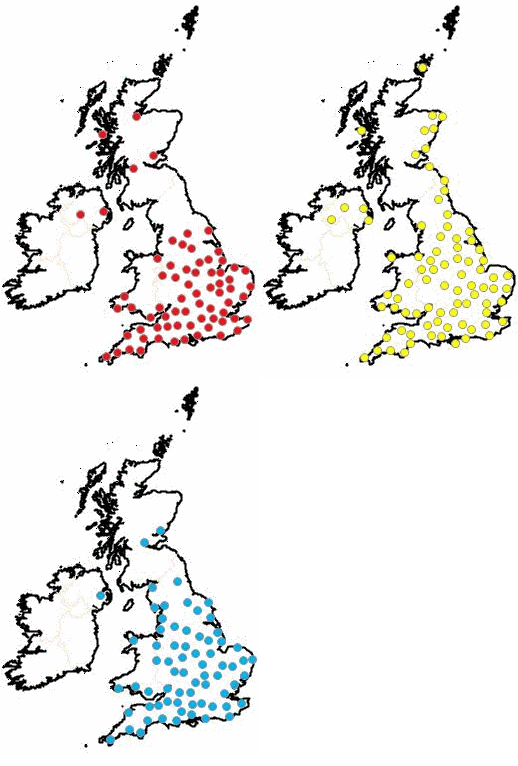
- There are more than 460 operational Solar PV developments, with a total capacity of approximately 2GW. These are represented by red markers on the image to the right.
- 370 under construction (1.7GW); Yellow markers.
- 258 (2.7GW) in planning; [3]. Blue markers.
These figures show that operational solar developments in the near future could double in numbers and triple in capacity
In conclusion
Worldwide Solar PV developments are rapidly increasing both in numbers and capacity. Environmental concerns due to cumulative impacts, as in the case of Glint and Glare, are expected to grow. In the UK during the past year we have already witnessed concerns being raised for radio and radar interference on a few occasions with specific reference to cumulative concerns. If you have had cumulative concerns on Glint and Glare raised we would appreciate if you could share it with us.
References
[1] European Photovoltaic Industry Association (2014): Global Market Outlook for Photovoltaics 2014 – 2018.
[2] PVPS Report Snapshot of Global PV 1992 – 2013 (2014): Preliminary Trends Information from the IEA PVPS Programme.
[3] Department of Energy & Climate Change (2014): Planning Database (6 October 2014).
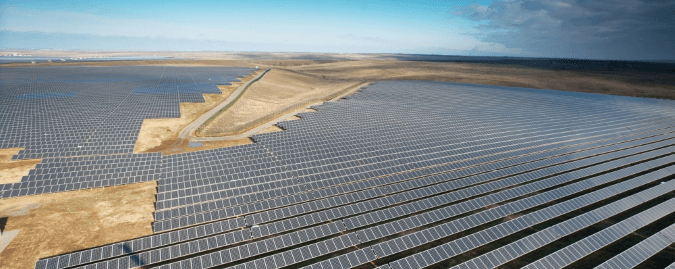
Image accreditation: “Perovo Solar Park” by Activ Solar / CC BY-SA 2.0 / Resized and cropped from original.
