How Green is Your Electricity?

Despite the massive growth in renewable electricity generation switching a light on usually results in more fossil fuels being burnt and increased carbon emissions. The level of emissions is heavily dependent on geography and time.
Carbon Intensity
The level of carbon dioxide emitted when electricity is used depends on the generation mix. Electricity generated predominantly by wind and solar causes low emissions whereas electricity generated by coal, oil and gas causes much higher emissions.
Carbon Intensity defines the level of carbon dioxide emissions in grammes per kilowatt hour. Analysis of electricity consumption in Great Britain in January this year (1/1/22 to 29/1/22) showed that regional Carbon Intensity ranged from 0 to 608 with an average of 172. The pie charts below show typical generation mixes.
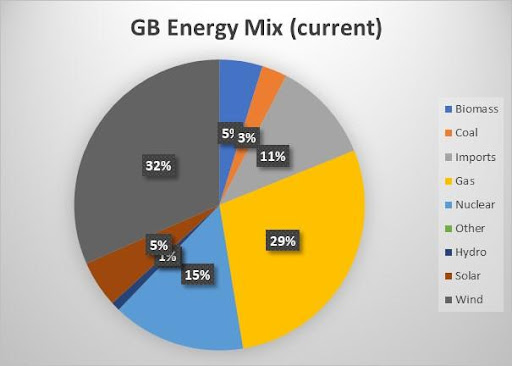
Figure 1: Typical energy mix – Great Britain – 29 Jan 2022 – 1530. Biggest contributors are Wind and Gas.
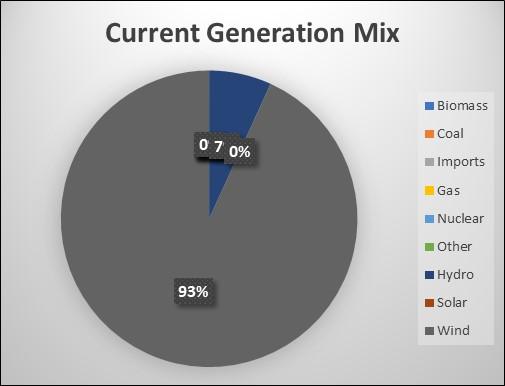
Figure 2: Zero carbon energy mix – Northern Scotland – 29 Jan 2022 – 1530. Only contributors are Wind and Hydro (7%).
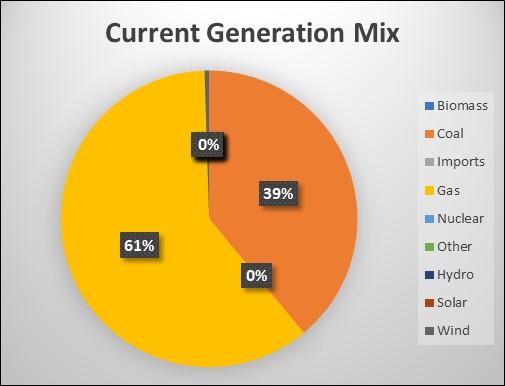
Figure 3: Very high carbon energy mix – East Midlands – 24 Jan 2022 – 1730. Main contributors are Gas and Coal.
Geography
Carbon Intensity varies markedly from region to region being heavily influenced by the level of demand in the region and the availability of generation from non-carbon sources. The chart below shows the average regional carbon intensity this January.
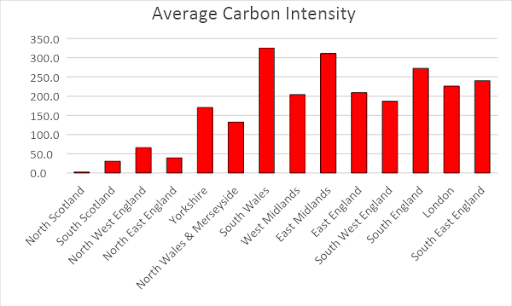
Figure 4: Average Regional Carbon Intensity.
The chart shows that, on average, electricity consumed in the North of Scotland is virtually carbon-free (2.8 grammes per kWh) whereas electricity consumed in South Wales (325 grammes per kWh) and East Midlands (311 grammes per kWh) causes more than one hundred times as much carbon dioxide to be emitted.
Time
Carbon intensity can vary significantly with time – although it doesn’t always. The chart below shows carbon emissions increasing by a factor of nearly five over a period of eighteen hours.
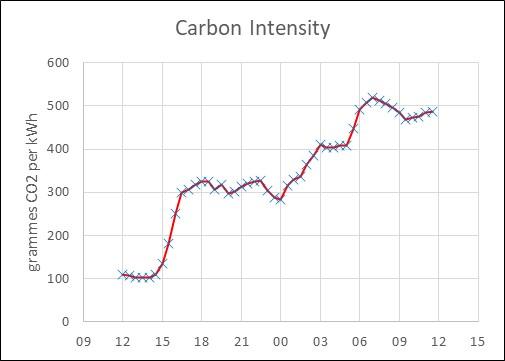
Figure 5: Regional Carbon Intensity – East Midlands – From noon 29 January 2022.
In this example the change is mainly due to a big decrease in wind and wind generation over the period.
Conclusions
The climate impact of our electricity use varies significantly with geography and time. In practice most of us do not have the luxury of being able to choose where or when we consume electricity. If you are planning a business or process that is electricity intensive it would make sense to locate it in the north of Scotland which has a (relative) abundance of low carbon electricity.
About Pager Power
Pager Power undertakes technical assessments for developers of renewable energy projects and tall buildings worldwide. For more information about what we do, please get in touch.
Thumbnail image accreditation: Mitchell Orr (June 2021) on Unsplash.com. Last accessed on 20th February 2022. Available at: https://unsplash.com/photos/Td-zqL6SPNs
post contents
About the Author: Mike
Latest News
What Data Do Solar Glare Consultants Need Before They Can Model The Impact?
For any project involving solar panels, or any other potentially [...]

Feline Happiness and Sustainability: Small Changes That Make a Difference
Here at Pager Power, sustainability is at the heart of [...]

Welcoming Eleanor Coughlan, Our New Administrative Officer
We are pleased to announce the newest addition to our [...]


