Tullamore Solar Farm, Republic of Ireland

In 2016, Elgin Energy commissioned Pager Power Ltd to investigate and assess the possible effects of glint and glare from a proposed solar photovoltaic (PV) development located northwest of Tullamore in County Offaly, Ireland. The development is known as the Tullamore Solar Farm.
The solar farm will have a generating capacity of 8MW and cover 17.7 hectares of land. The assessment modelled the effects of glint and glare upon ground level receptors including roads and dwellings.
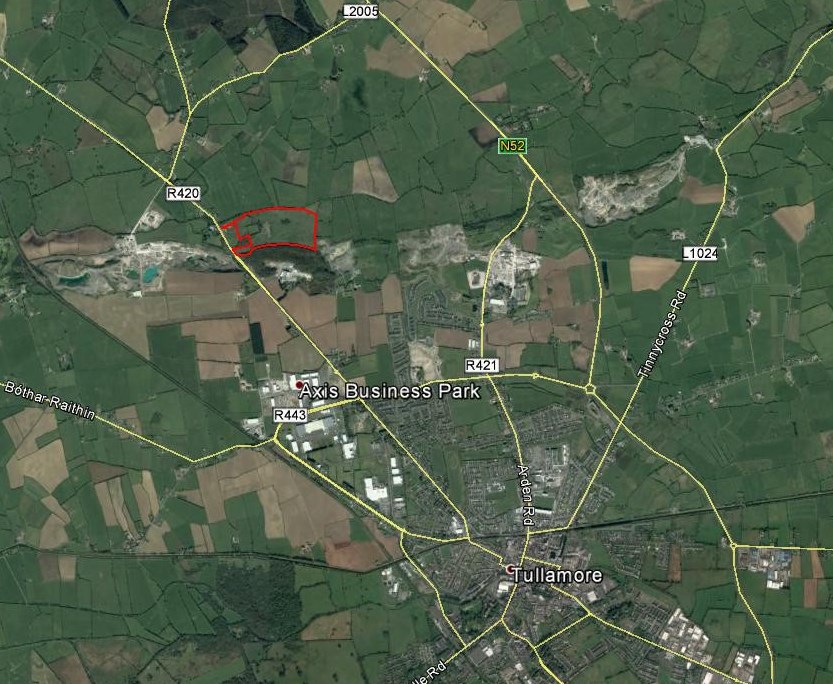
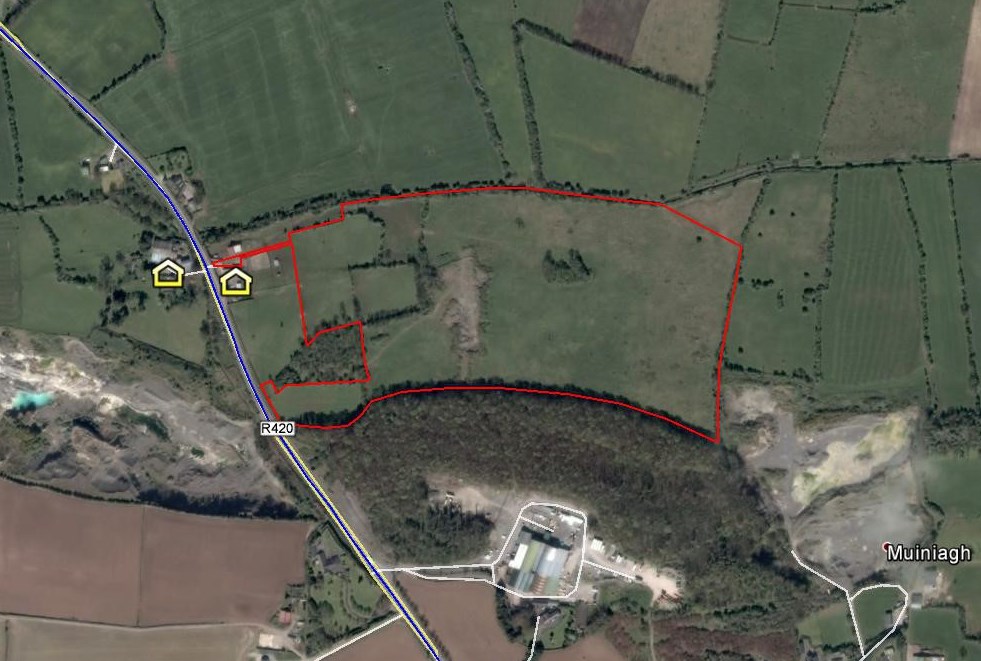
The site boundary of the solar farm can be seen in Figure 1[1] (red line).
Background
Undertaking a glint and glare assessment for ground level receptors such as roads and dwellings is a common request for proposed solar developments in Ireland.
It is Pager Power’s methodology to consider for assessment all roads and dwellings with 1km of a solar development.
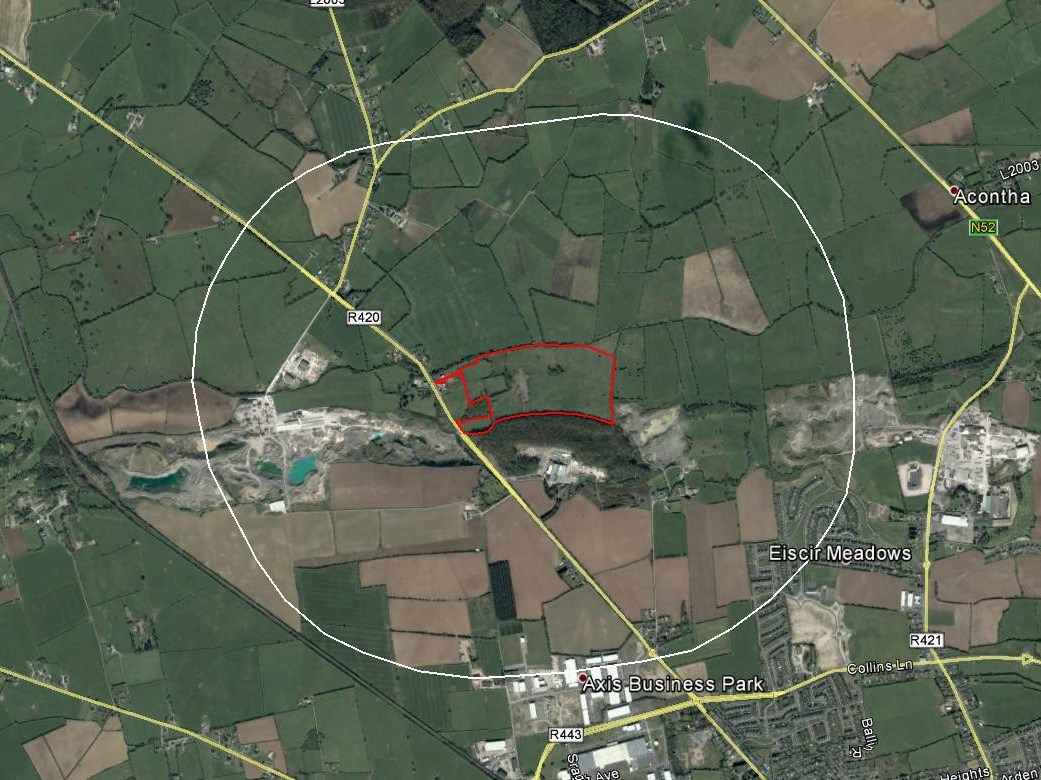
Within 1km of the Tullamore Solar Farm lies the R420 as well as a number of local and minor roads. There are also a number of individual dwellings as well as a densely populated area to the south east. Figure 2[2] shows the site boundary and 1km assessment area (white line).
The subsequent assessment was based on desk based data collection.
The Challenge
There were three prominent challenges associated with this project:
- The solar farm was located within meters of a regional road where traffic speeds and density may be high.
- Clear views from the road existed based on the review of existing screening.
- Two dwellings were located in close proximity of the solar farm boundary to the west.
The location of these receptors can be seen in Figure 3[3] (blue line – road and dwelling icons).
The Process
In the first instance, Pager Power identified all roads and dwellings within 1km of the solar farm which had a reasonable prospect of being able to view all or parts of the solar farm. This included assessment of 1.3km of the R420 and 17 dwellings.
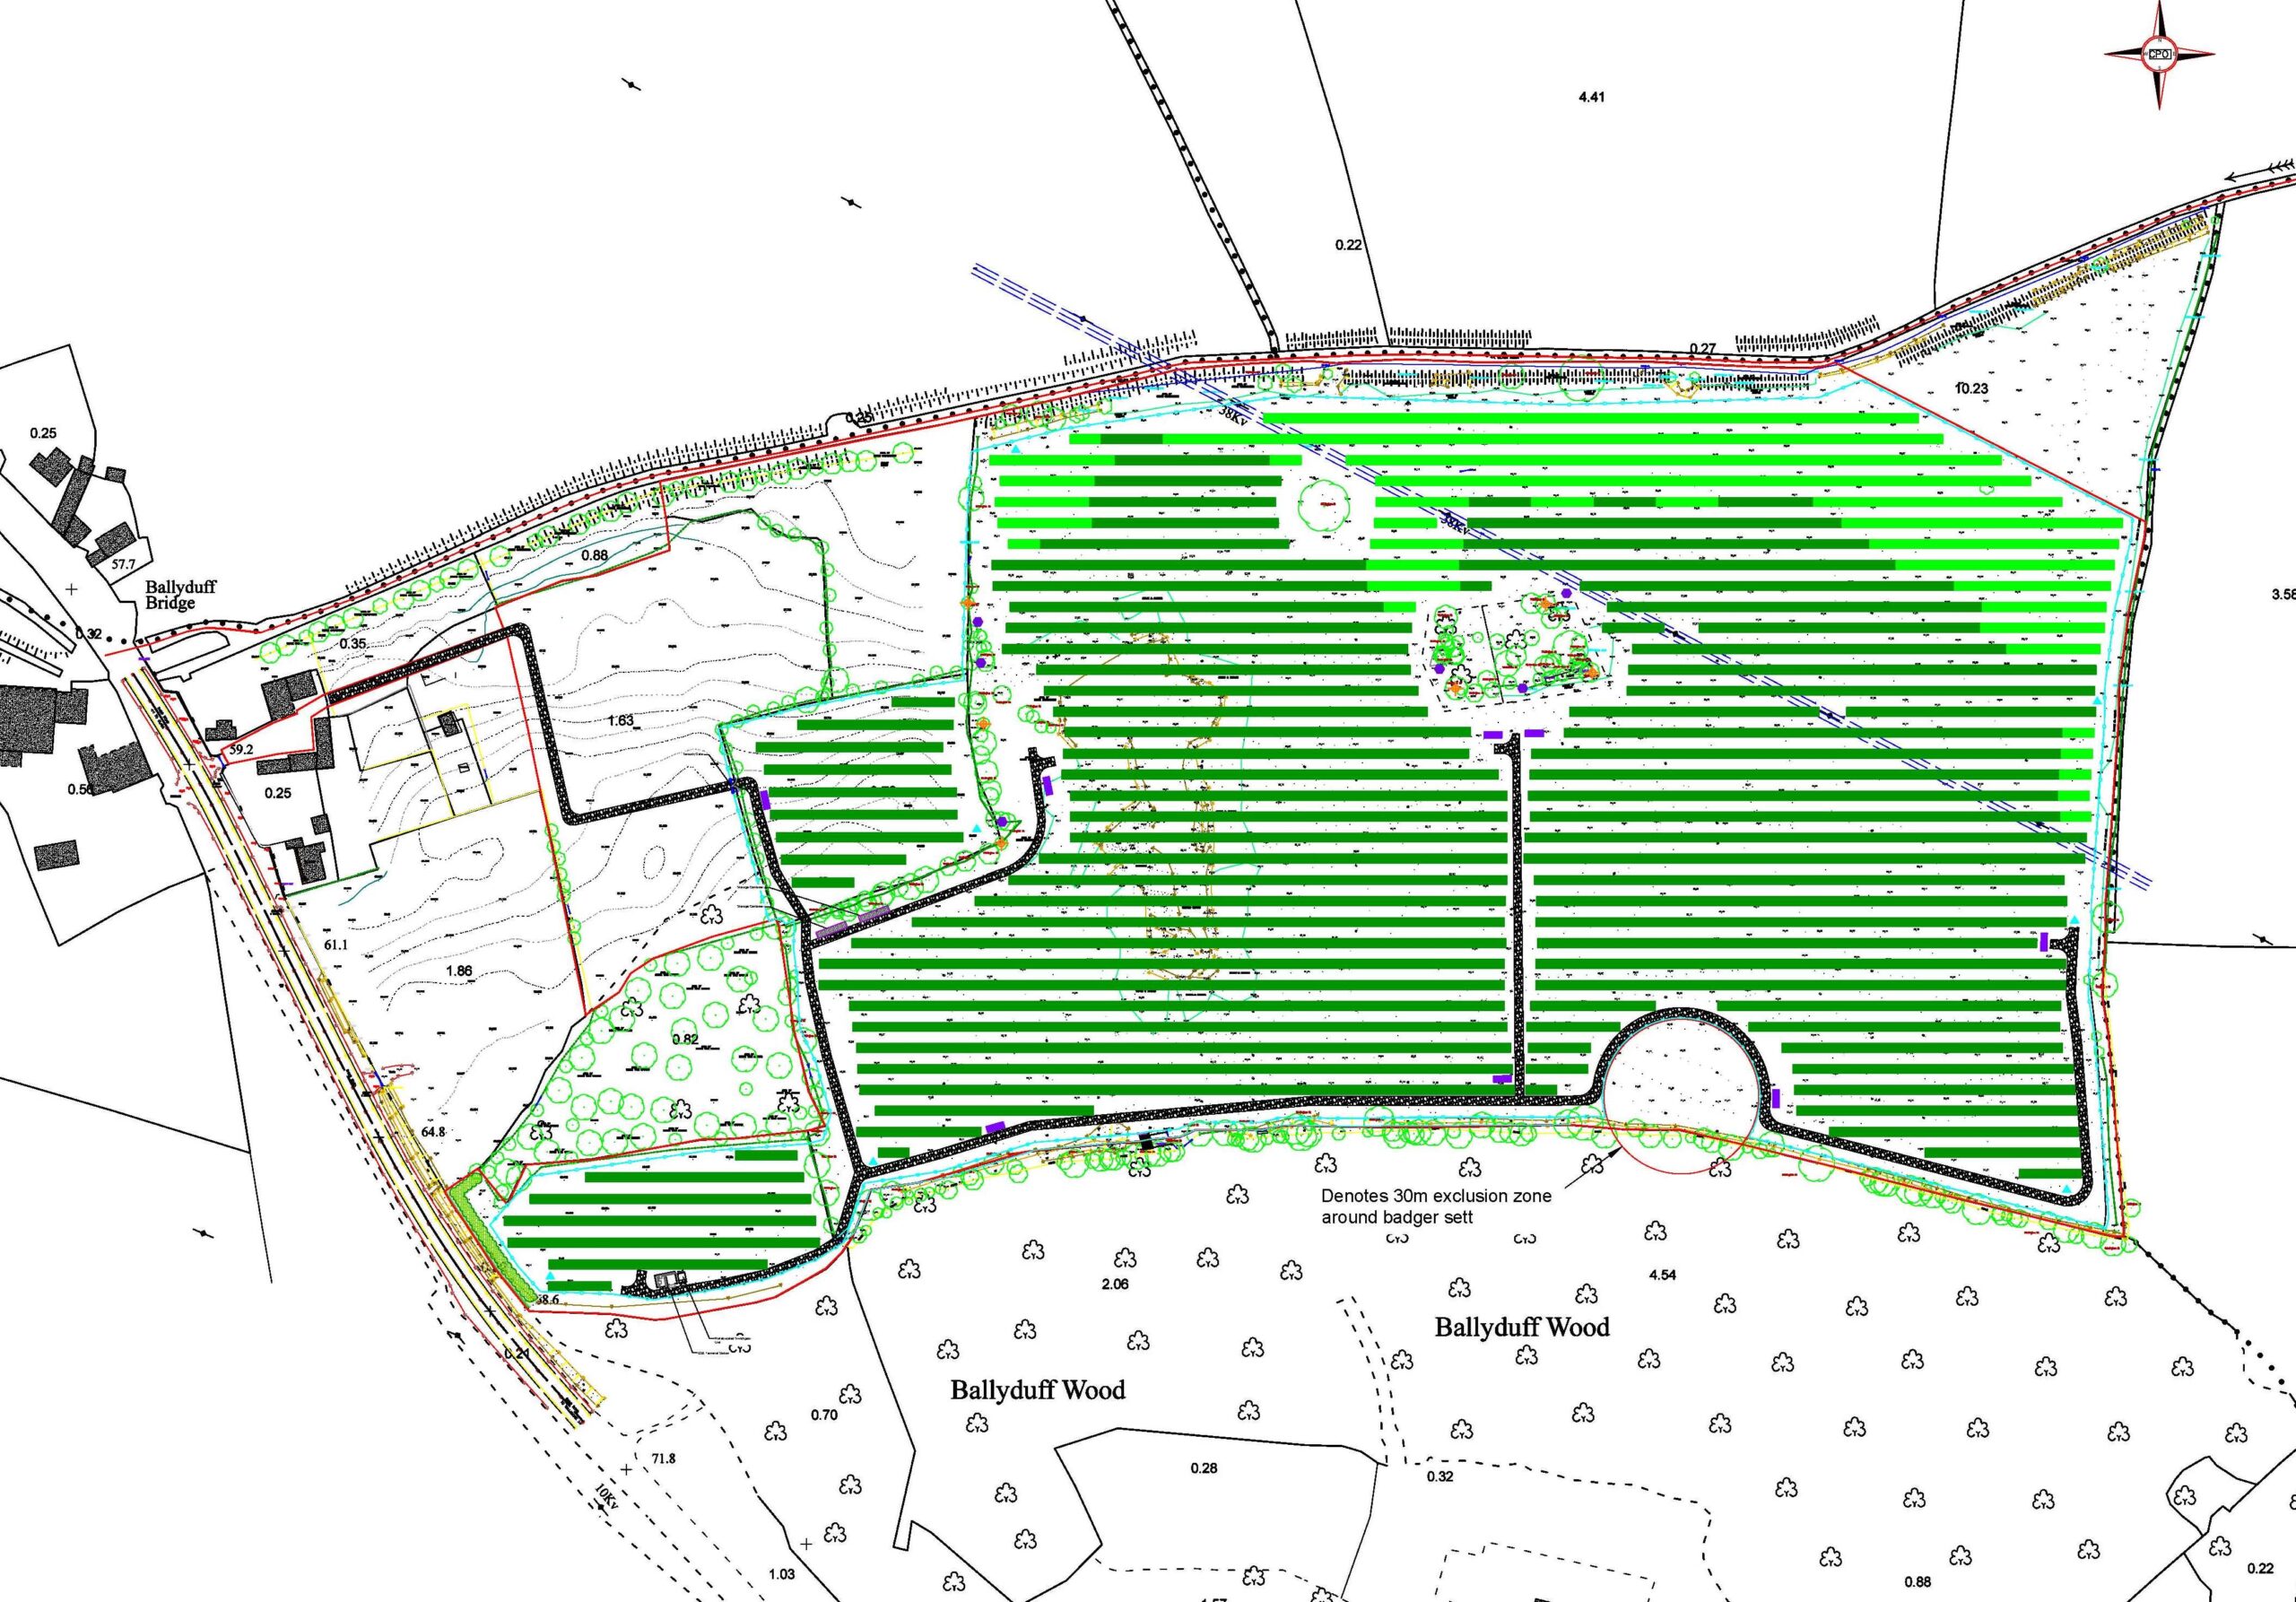
Following this, the solar farm panel boundary was defined. This area can be seen in Figure 4, the green lines show the rows of solar panels.
Pager Power’s glint and glare model was then used to determine whether a solar reflection was possible at the identified receptors.
Where a solar reflection was geometrically was possible, a review of existing and proposed screening was completed to determine what effect, if any, existing vegetation would have on the visibility of the reflecting solar panels. The location of the Sun relative to the solar reflection at this time was also considered.
Finally, considering all of the above, the overall expected impact for road users and residents was determined.
The Solution
The results of the geometric analysis revealed that a solar reflection was possible towards approximately 170m of the R420 to the west of the solar farm. The developer proposed screening of 2m on the boundary of the solar farm nearest the road. This was predicted to screen the reflecting solar panels from view of the road resulting in no impact upon road users.
No solar reflections were predicted towards the surrounding dwellings because no view of the reflecting solar panels was expected, even in the absence of any proposed screening.
For this solar development, proposed screening removed all modelled impacts.
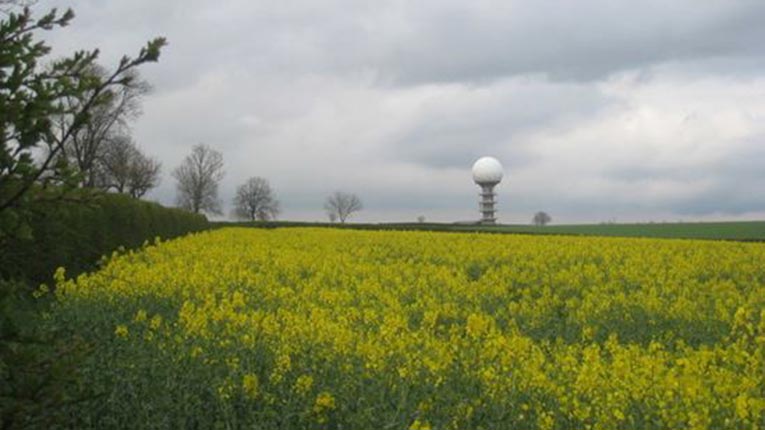
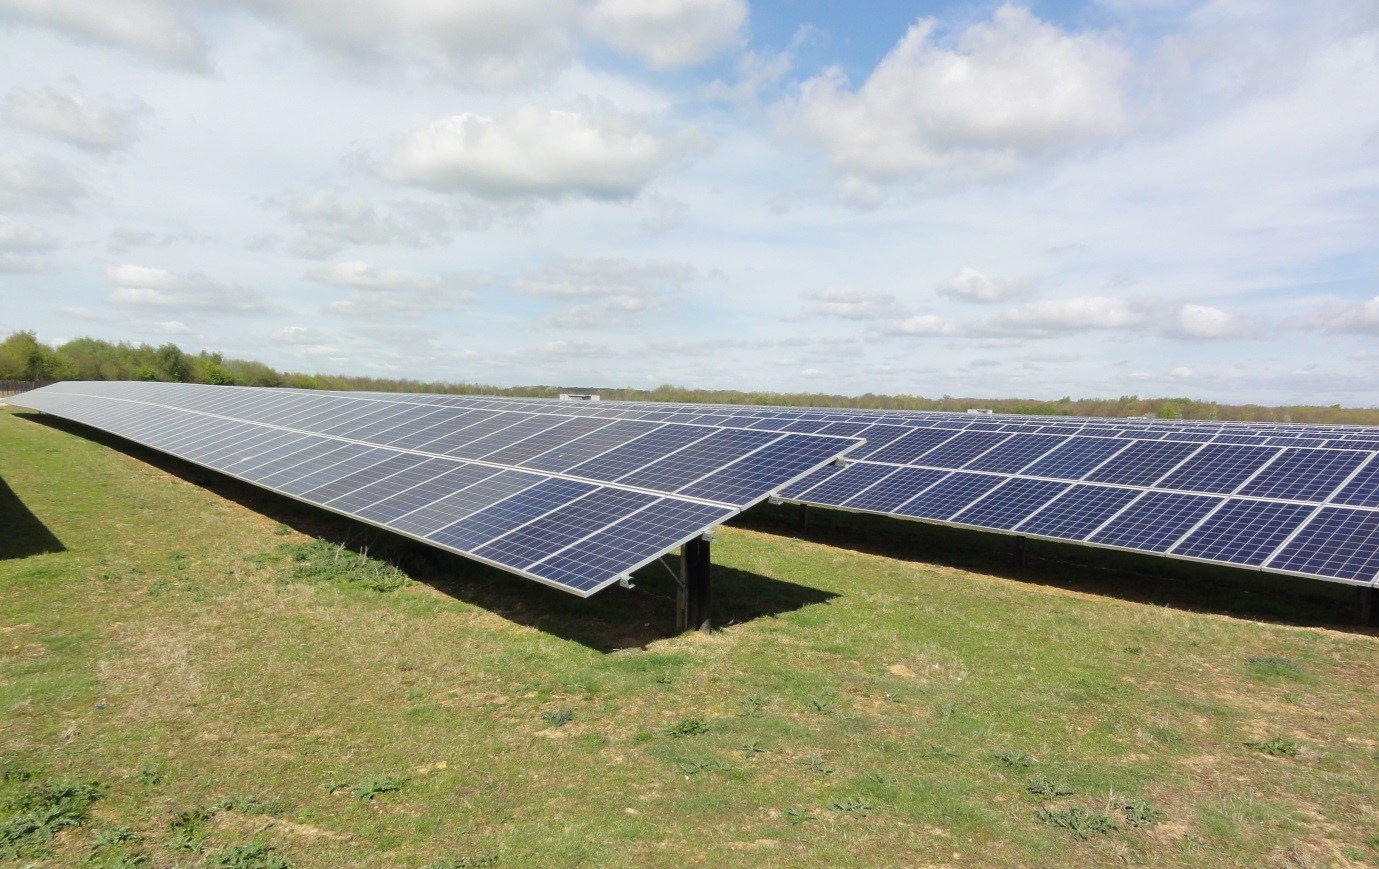
Figure 5 [4] below shows a photograph of a typical solar farm.
The Result
The results of Pager Power’s Glint and Glare Assessment were accepted by the local planning authority and Offaly County Council subsequently awarded planning permission for the Tullamore Solar Farm in mid-2017.
The solar farm will help contribute to the national target of achieving 40% Ireland’s electricity from renewable sources by 2020.
The Irish Solar Energy Association has stated that farming may continue between and underneath solar panels.
Construction of the solar farm will also be 100% reversible after the project’s planning permission expires.
[1] Source: © 2017 Google. Image. © 2017 Digital Globe.
[2] Source: © 2017 Google. Image. © 2017 Digital Globe.
[3] Source: © 2017 Google. Image. © 2017 Digital Globe.
[4] Source: Pager Power, 2017.
“Pager Power has provided a thorough, professional and timely service with excellent follow up. Their informed advice has provided crucial assistance to aid our clients’ decision making.”
Nigel Wright
Senior Project Manager, Turner & Townsend