The UK’s Floating Photovoltaic (FPV) Potential
 Potential")
Introduction
The cumulative capacity of worldwide floating photovoltaic (FPV) projects is currently 2600 MW, representing just 0.41% of the total cumulative capacity of all worldwide solar projects. However, momentum is building around FPVs due to the many benefits over their land-based counter parts – including those outlined in our Floating Solar Panels article.
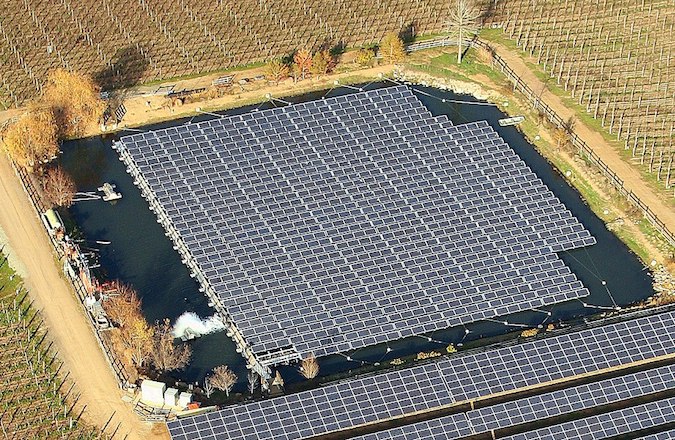
Figure 1: FPV system, Napa Valley California.
As more FPV projects are beginning to emerge, we take a look at their potential power generation here in the UK, and the limitations which may prevent reaching maximum capacity.
Potential UK Power Generation
Reservoirs and other man-made bodies of water are most commonly used for FPV projects as they are typically calm and still. Therefore, to gain an understanding of the potential power generation here in the UK, the potential power generation of FPV projects by utilising our top 10 largest reservoirs by surface area has been assessed.
The surface area of each reservoir and their associated MWp, based on the current estimated FPV efficiency, is presented in Table 1 below.
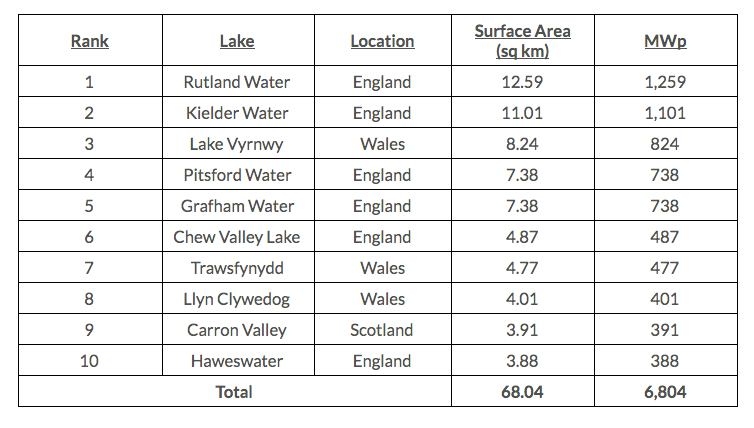
Table 1: FPV power generation using the UKs largest reservoirs.
The table shows that by utilising the 10 largest reservoirs in the UK, FPVs could have a peak capacity of 6,804 MW. When compared to the total UK solar capacity of 13,259 MW in June 2019, this correlates to an increase in solar power generation by over 50%.
The table also shows that the Rutland Water reservoir could have a peak capacity of 1259 MW all on its own. For scale, the largest solar park in the UK is currently Cleve Hill Solar Park, with a peak capacity of 350 MW.
Based on this analysis, it would seem obvious that FPVs should be utilised on all our reservoirs to generate power. Yet, FPVs may not be a viable option in every case and limitations to reaching maximum capacity may include:
- The high upfront and maintenance costs to have solar panel installed on the whole of the reservoir;
- Grid connection may not be available at the location of the reservoir meaning electricity would need to be distributed locally. The maximum capacity of the reservoir may therefore never be met as it could be much greater than the local power requirement;
- Seasonal fluctuation of the reservoir’s water level could mean that panel placement for maximum capacity is not achievable.
With these obstacles and far fewer locations to choose from, developers may opt for an easier land-based project instead.
Conclusions
The analysis has shown that FPVs could make a substantial contribution to power generation in the UK. Though there are some current limitations that could be halting its progress, it is likely that these obstacles could be overcome as the technology develops and will become an increasingly attractive option for developers in the future.
About Pager Power
Pager Power undertakes technical assessments for developers of renewable energy projects and tall buildings. For more information about what we do, please get in touch.
References
[1]pv magazine International. 2020. Floating Solar PV Gains Global Momentum. [online] Available at: <https://www.pv-magazine.com/2020/09/22/floating-solar-pv-gains-global-momentum/> [Accessed 28 October 2020]. [2] WorldAtlas, 2020. The Largest Reservoirs In The United Kingdom. [online] WorldAtlas. Available at: https://www.worldatlas.com/articles/the-largest-reservoirs-in-the-unitedkingdom.html#:~:text=The%20construction%20of%20reservoirs%20can,them%20in%20the%20country%20today/[Accessed 28 October 2020]. [3]Liu, L., Wang, Q., Lin, H., Li, H., Sun, Q. and wennersten, R., 2020. Power Generation Efficiency And Prospects Of Floating Photovoltaic Systems. [4] Green Match, 2020. The UK’s Solar Capacity Explained (2020) | Greenmatch. [online] Greenmatch.co.uk. Available at: <https://www.greenmatch.co.uk/blog/2019/09/uk-solar-capacity#:~:text=Insights%20%26%20Projections%20of%20UK%20Solar,the%20other%20EU%20member%20states./> [Accessed 28 October 2020].Image accreditation: https://commons.wikimedia.org/wiki/File:Floating_PV_system_Far_Niente_Winery_California_2018.jpg
post contents
About the Author: Michael Sutton
Latest News

Anti-Glare Solutions for Solar Panels
Depending on the surface conditions reflections of light can be [...]
How Can Glare Risks be Reduced for my Solar Project?
Glare is an important environmental impact to consider during the [...]
Wind Turbine Consultation Open for the Eskdalemuir Seismic Array
What is the Eskdalemuir Seismic Array? The Eskdalemuir Seismic Array [...]


