What are the latest improvements to our Glint and Glare model?
Pager Power has been working on two improvements to the latest iteration of our bespoke glint and glare model used in all geometric glint and glare assessments. The model now incorporates these two significant improvements:
- Inclusion of the Sun azimuth range (for when a solar reflection is geometrically possible).
- Modelling of the visible horizon from the location of the proposed solar farm.
How do these advancements improve the Glint and Glare modelling results?
The latest advancements mean the geometric calculation results are more accurate and provide more information for contextualising any predicted solar reflection.
The inclusion of the Sun azimuth range means it is now possible to determine and show where the Sun will be in the sky with respect to a calculated geometric solar reflection. This means that it is easy to determine whether the direct sunlight will be incident i.e. originate from a similar location to that of the solar reflection from the solar panels. The Sun azimuth range is highlighted in Figure 1 below (top right).
Figure 1: Glint and glare modelling results showing the Sun azimuth range (top right) – no visible horizon included.
In this instance, the receptor is due immediately west of the example solar farm area with solar reflections geometrically possible in March and September from panels to the north of the solar farm (yellow area). The chart in the top right shows that the Sun azimuth range is between 89.4° and 92.1° (due east of the receptor and due east of the solar farm). The observer difference angle is between 0° and 3° meaning that the direct sunlight would indeed be incident to any solar reflection. This means therefore that direct sunlight will likely be visible from the same direction as any solar glare from the solar panels thus reducing the perceived impact of any solar reflection.
The inclusion of the visible horizon data means that the geometric modelling results are even more accurate. In previous iterations, a flat horizon was assumed but of course this is not the case. In reality, the terrain profile of the horizon can vary significantly, meaning that the terrain can block the Sun from view of the panels at the visible horizon. This will usually occur in the morning (sunrise) and the evening (sunset). Figure 2 shows the results of the same geometric calculation as shown in Figure 1, however in this chart the horizon data has been included [1].
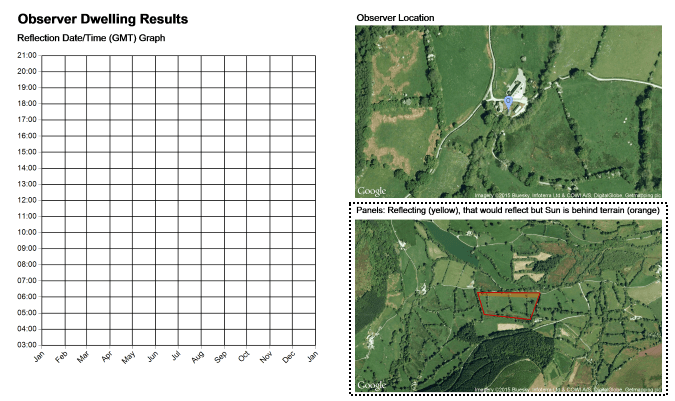
Figure 2: Glint and glare modelling results with visible horizon included
The highlighted chart (bottom right) shows the solar panels that would produce a reflection of the Sun but, because of the inclusion of the visible horizon, now no solar reflection is predicted, hence the chart shows a geometrical reflection is not possible at any time. This highlighted orange panel area is the same as that shown in Figure 1 where it shows the solar panels producing a solar reflection.
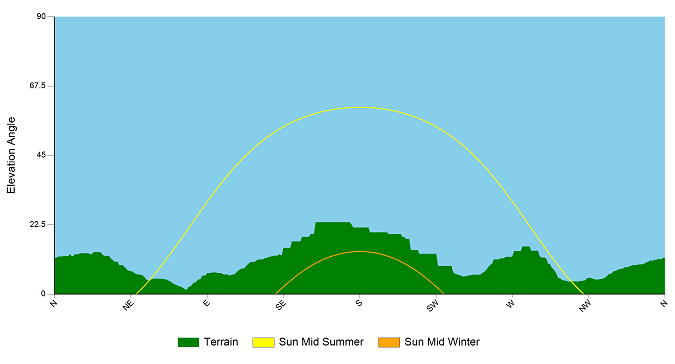
Figure 3 below shows the horizon data along with the path of the Sun during the longest and shortest days of the year (2016).
Figure 3: Visible horizon chart with the Sun’s path at the example solar farm location
The visible horizon chart shows the terrain profile at the horizon with respect to the example solar farm location. Whilst this may not be an ideal location for a solar farm (no Sun light would directly hit the solar panels in mid-winter) it is a clear example showing the effects of the visible horizon on the prediction of glint and glare for surrounding receptors.
Conclusions
We are continually improving our tools and models and we feel the latest iterations significantly increase the accuracy for modelling solar glint and glare and its perceived impact.
[1] Inclusion of horizon data is currently available for reports in England, Scotland and Wales


