This article presents an overview of the modelling charts produced with our bespoke Glint and Glare analysis tool. For this, an example Glint and Glare chart has been produced. An example solar farm location was chosen to the west of the Pager Power office, with the receptor being the top floor of the office. The solar farm area and the office location are shown in Figure 1 below
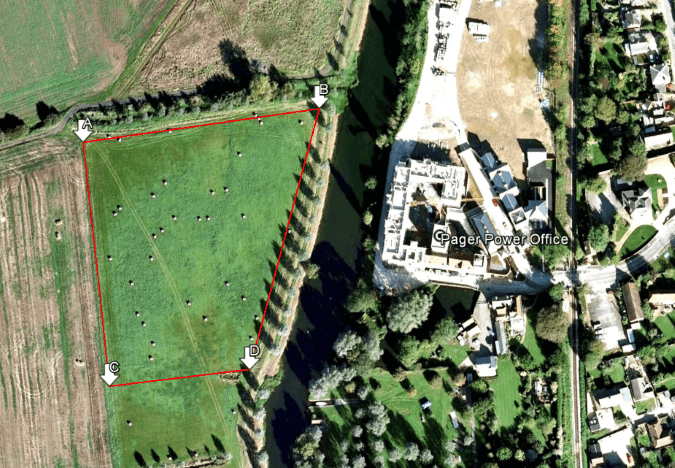 Figure 1: example solar farm and office receptor location.
After the solar farm information (including panel angle and height above ground level) and receptor details are fed into the model, a full glint and glare chart is produced. This chart is shown in Figure 2 below.
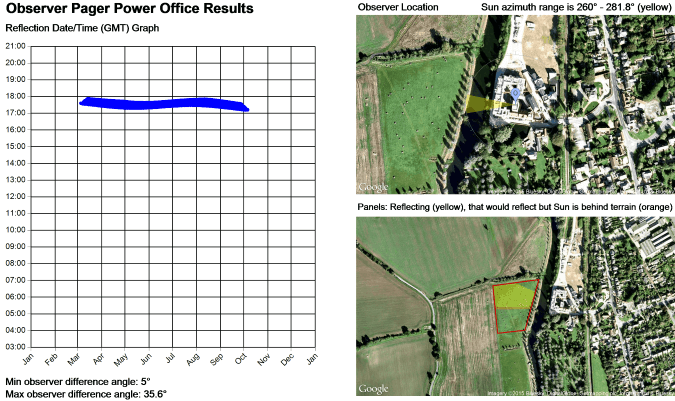 Figure 2: Solar reflection chart.
The Date/Time Graph
The date/time graph produced is shown on the left of the chart. The graph shows the months and days of the year on which glare could occur. In this example, solar reflections would be possible between March and early October at times between approximately 17:00-18:00 GMT.
The thickness of the line shows the length of time for which solar glare could be experienced by the assessed receptor. In this case, the solar reflections could last for up to approximately 35 minutes on any one day. The tool does not account for expected weather conditions and is therefore modelling a worst-case scenario.
Receptor location/Sun azimuth range
The receptor location and the Sun azimuth range are shown within the same image to the top right of the chart. The azimuth range is the angle between the Sun and grid North, measured clockwise around the observer’s horizon. The Sun azimuth range shows the location of the Sun when a geometric solar reflection is possible. This means it is easy to determine whether the Sun and the solar reflection are likely to be visible to the observer (receptor) when looking towards the proposed solar farm. The Sun azimuth range figures are also presented at the top of the chart (Figure 2).
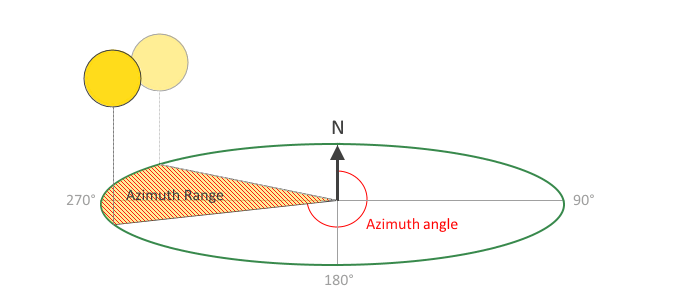 Figure 3: Sun azimuth diagram.
In this example, the Sun azimuth range when a solar reflection can occur varies between 260.0°-281.8° (due west of the Pager Power office). The example solar farm is also located due west of the office and therefore is possible the Sun and the solar glare will be visible at the same time.
Minimum/maximum difference observer angle
These figures are shown to the bottom left of the date/time graph. These numbers show the minimum and maximum difference angle (from the observer’s perspective) between the predicted solar reflection and the Sun.
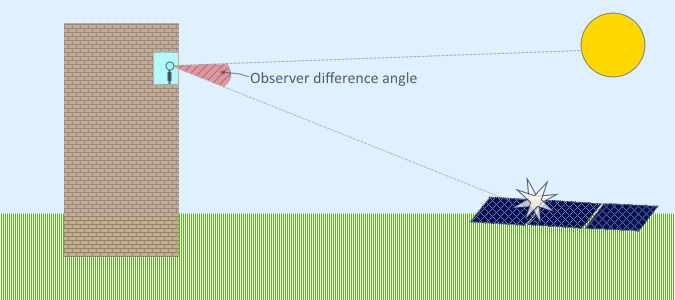 Figure 4: Diagram showing the observer difference angle.
In this instance, the minimum observer difference angle is 5° and the maximum is 35.6°. If this angle is small, it means the Sun and the solar reflection would appear to be close to one another. If this angle were large then the Sun and the solar reflection would appear to be separate. In all instances, the Sun is considered the most intense source of incoming light to an observer.
The reflecting solar panels
The image to the bottom right of the chart shows the area of the proposed solar farm (red boundary) from which the solar panels could produce a solar reflection towards the assessed receptor location (yellow area). The orange area shows the solar panels that could create a visible geometric reflection, if it were not for the terrain at the horizon obstructing the view of the Sun to the solar panels. This is discussed further in this news article titled ‘Further advancements to Pager Power’s Glint and Glare model’.
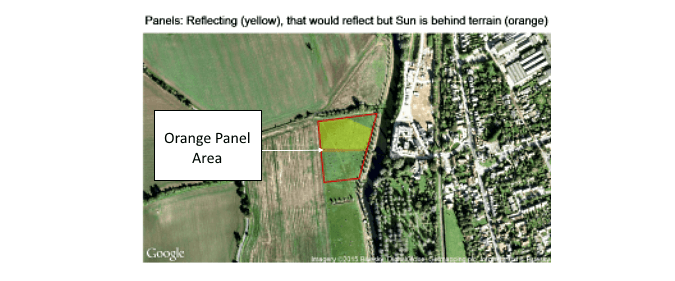 Figure 5: Solar farm area showing panels where geometric reflections are possible. Orange area shows where the horizon obstructs the Sun from view of the panels.
In this instance, solar reflections towards the office would generally occur from the most northern solar panels.
Conclusions
All of the analysis presented within the chart is considered when determining whether a solar reflection from a proposed solar farm is likely to produce a significant impact. If you require any further clarification on our model or our Glint and Glare assessments, please get in touch.

