Many of you will appreciate that accurately calculating height data when performing wind turbine – radar interference analysis is important. There are many methods to choose from, but at Pager Power we selected to use a Weighted Average algorithm in our assessments. And we’d like to share with you why.

Radar Line Of Sight Analysis
Radar line of sight analysis is a good indication of whether a wind turbine will affect a radar installation. The most important result of the analysis is the visible height – the extent to which a turbine is within, or beneath, the radar beam.
It is important that the results are accurate and conservative. This enables decision makers to rely on the results.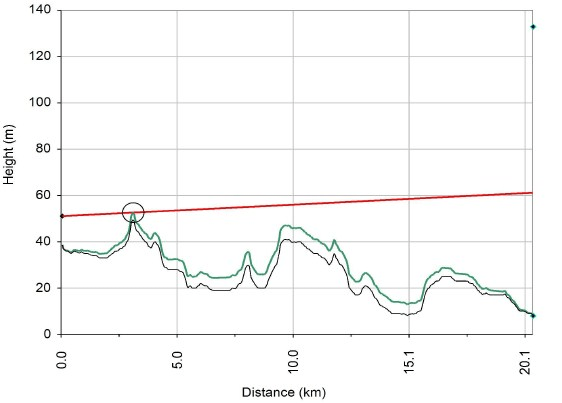
Accuracy of the chart (example to the right) and visible height result is dependent on:
- Location and heights for the radar and wind turbine.
- The height data accuracy.
- Computing algorithm used to create the profile.
Terrain Profile
The building block of radar line of sight analysis is the terrain profile between the turbine and the radar.
For computer generated charts, the terrain profile is built from height data along the path between the radar and the wind turbine. Height data is often derived from Digital Surface Models (DSM) or Digital Terrain Models (DTM).
Height data points are often equally spaced in a grid formation with the distance between points known as post spacing.
Ordnance Survey (OS) DTM data has a post spacing of 50 metres.
When performing analysis, it is incredibly unlikely that the areas of interest will fall exactly on height data points. For this reason, the height at a particular location must be calculated from the surrounding data points. This method is referred to as interpolation.
Interpolation Algorithms
A number of interpolation algorithms exist for doing this. Three methods are:
- The Nearest Neighbour
- “Centring Type”
- Weighted average
Would it be helpful to see an example of how these would work?
The diagram below shows a location X of unknown height and the surrounding height data points DTM 1, DTM 2, DTM 3 and DTM 4.

Nearest Neighbour Algorithm
The Nearest Neighbour algorithm would assume the terrain is flat and put the height of X the same as the nearest point i.e. DTM 1.
“Centring Type” Algorithm
The “centring type” algorithm would calculate the height of X as the centre of the square. It would average the height of each DTM 1, DTM 2, DTM 3 and DTM 4.
Weighted Average Algorithm
The weighted average algorithm, what we use in our assessments, would calculate the unknown height of X from those of the DTM 1, DTM 2, DTM 3 and DTM 4. But instead of the heights of each of the four points contributing equally to the final average – as in the “Centring Type” – some would contribute more than others.
Credibility and Accuracy
When compared with the Nearest Neighbour and “Centring Type”, the Weighted Average algorithm is the most accurate and conservative for wind turbine radar line of sight assessments. One for this is that the averaging process does not overestimate the height of intervening terrain between radar and wind turbine.
For maximum confidence ensure your wind turbine radar assessments use a Weighted Average algorithm.
Image accreditation: “Hills, grain elevator, and little yellow plane (really)” by Lynn Suckow / CC BY/ Cropped and resized from original.